TradeBit.pro: A Free Crypto Scanner for Smarter Trading Decisions

The cryptocurrency market never stands still. Prices can change rapidly, trading volumes can spike within minutes, and new opportunities can emerge across hundreds of trading pairs. For traders who want to keep up with these movements, manually monitoring the entire market can be time-consuming and inefficient.
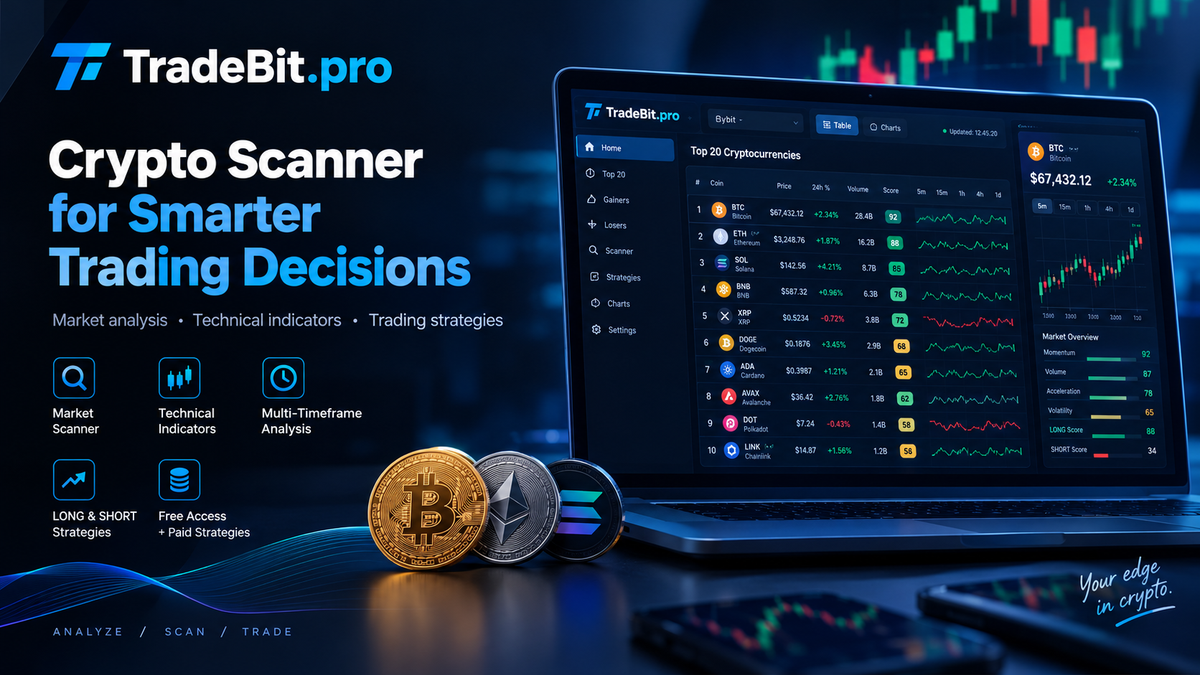
TradeBit.pro is a cryptocurrency market scanner designed to help traders identify significant price movements, analyze market activity, and discover potential trading opportunities. Its core scanning functionality is free to use, while selected trading strategies are available through paid access plans.
Whether you are exploring crypto trading for the first time or already have experience analyzing technical indicators, TradeBit.pro helps you focus on the market movements that deserve your attention.

What Is TradeBit.pro?
TradeBit.pro is a crypto market analysis platform that goes beyond displaying cryptocurrency prices. It processes market data and ranks trading pairs according to different characteristics, helping users identify assets experiencing notable changes in price, volume, volatility, and momentum.
Instead of manually checking charts for hundreds of cryptocurrencies, traders can use the scanner to narrow their attention to relevant market activity.
The platform focuses on several key areas:
- Market scanning: Find cryptocurrencies experiencing strong upward or downward movements.
- Momentum analysis: Identify assets where price movements are accelerating.
- Volume analysis: Discover trading pairs with significant trading activity.
- Volatility monitoring: Find assets experiencing increased price fluctuations.
- Trading strategies: Explore potential LONG and SHORT opportunities using strategy-based analysis.
- Technical indicators: Evaluate price momentum and other market characteristics across multiple timeframes.
The goal is to make market analysis more efficient by organizing large amounts of information into a practical, easy-to-use interface.
Key Features of TradeBit.pro
1. Cryptocurrency Market Scanner
The market scanner helps identify trading pairs that stand out from the rest of the market.
Rather than looking at price changes alone, TradeBit.pro offers different scanning modes designed to highlight specific types of activity.
Depending on the selected mode, traders can explore:
- Strongest price increases.
- Strongest price declines.
- Accelerating price movements.
- Trading pairs with high trading volume.
- Assets experiencing increased volatility.
- Potential breakouts and market reversals.
These views help traders quickly identify where market activity is concentrated and decide which charts deserve further investigation.
2. Multi-Timeframe Market Analysis
A price movement can look very different depending on the timeframe being analyzed. A short-term rally, for example, may occur during a broader downtrend.
TradeBit.pro analyzes market data across multiple timeframes:
- 5 minutes (5m).
- 15 minutes (15m).
- 1 hour (1h).
- 4 hours (4h).
- 1 day (1d).
This allows users to compare short-term momentum with broader market behavior and look for situations where several timeframes support the same direction.
Market data is updated automatically, allowing the scanner to reflect changing conditions without requiring users to refresh every chart manually.
3. Technical Indicators and Market Scores
Raw market data does not always make it easy to compare different assets. TradeBit.pro uses technical indicators and scoring mechanisms to organize market information into more understandable rankings.
The platform’s analytical framework includes indicators and measurements such as:
- Rate of Change (ROC).
- Relative Strength Index (RSI).
- Commodity Channel Index (CCI).
- Money Flow Index (MFI).
- Volatility measurements based on Average True Range (ATR).
- Trading volume and volume changes.
- Bollinger Bands and price movement characteristics.
The scanner also uses different scores to evaluate market movement, volume, acceleration, volatility, and potential LONG or SHORT conditions.
A higher score indicates a stronger match with the criteria used by the relevant scanner mode or strategy. It should not be interpreted as a probability of profit or a guarantee that a price movement will continue.
By combining multiple measurements, TradeBit.pro helps traders compare assets and investigate potentially interesting market conditions.
4. LONG and SHORT Trading Strategies
Not every trader looks for the same type of opportunity. Some focus on upward momentum, while others look for bearish setups or potential reversals.
TradeBit.pro includes a strategy framework covering different market scenarios.
LONG strategies focus on conditions that may support upward price movement. Depending on the strategy, relevant factors can include positive momentum, increasing volume, breakouts, and confirmation across multiple timeframes.
SHORT strategies focus on bearish conditions, including negative momentum, accelerating declines, and potential downward breakouts.
Additional strategy concepts include:
- Pump: Identifying potential strong upward impulses.
- Bounce: Searching for potential rebounds after significant declines.
- Reversal: Looking for possible changes in the prevailing direction.
- Dump: Identifying strong downward movements.
These strategies are analytical tools, not automatic trading systems. They help users identify conditions worth examining before making their own trading decisions.
Selected strategies may require a paid access plan, while the core scanner remains free.
5. Detailed Coin Analysis and Price Charts
A market ranking is only the starting point. Before making a trading decision, users often need to investigate an individual asset in greater detail.
TradeBit.pro provides a dedicated coin analysis view designed to bring together relevant market information, including:
- Current price.
- Price changes across supported timeframes.
- Market movement and volume scores.
- Acceleration and volatility measurements.
- LONG and SHORT scores.
- Strategies matching the asset’s current conditions.
- Candlestick charts for further analysis.
The chart interface helps users examine price behavior rather than relying exclusively on a ranking or numerical score.
This combination of scanning and detailed chart analysis creates a more practical workflow: discover an interesting asset, investigate its price action, and decide whether the setup fits your own trading approach.
Is TradeBit.pro Free?
Yes. The core TradeBit.pro cryptocurrency scanner is free to use.
You can use the scanner to explore market movements and analyze cryptocurrency trading pairs without needing to purchase a strategy subscription.
For traders who want more specialized analytical tools, selected strategies are available through paid access plans.
The platform follows a straightforward model:
- Free access: Core market scanning and available analysis features.
- Paid strategy access: Access to selected strategies according to the applicable plan.
- Flexible choice: Users can decide whether the additional strategy features are relevant to their trading approach.
The exact features, prices, and access conditions depend on the plans currently offered on TradeBit.pro. Check the official pricing information before purchasing a paid strategy.
This approach allows users to explore the platform first and consider paid features only when they need additional analytical capabilities.
Who Can Benefit from TradeBit.pro?
TradeBit.pro is designed for different types of cryptocurrency market participants.
Active traders can use the scanner to find assets with strong momentum, unusual volume, or increased volatility without constantly monitoring every trading pair.
Technical analysis enthusiasts can compare indicator readings, examine multiple timeframes, and investigate the market conditions behind a scanner result.
LONG and SHORT traders can explore strategy-based rankings to identify potential bullish or bearish setups for further analysis.
Beginners can use the different scanner modes to learn how momentum, volume, volatility, and technical indicators relate to price behavior. The scanner can support the learning process, although understanding trading risks and market fundamentals remains essential.
Experienced traders can incorporate market scanning into an existing workflow, using the platform as a research tool alongside their own charts, risk management rules, and trading systems.
TradeBit.pro does not require users to follow a single trading style. Its different analytical modes allow traders to focus on the market characteristics that matter most to them.
How to Use a Crypto Scanner More Effectively
A market scanner is most useful when it helps narrow down the market rather than replacing the trader’s own analysis.
Here is a practical workflow for using TradeBit.pro:
Step 1: Choose a scanning mode.
Start with the market behavior you want to investigate. For example, select strong growth to find upward movers, acceleration to identify changing momentum, or volatility to explore assets with larger price fluctuations.
Step 2: Compare multiple timeframes.
Check whether a movement appears only on a short timeframe or is also visible on longer intervals. This can provide useful context before investigating an asset further.
Step 3: Examine the relevant scores and indicators.
Use movement, volume, acceleration, and volatility measurements to compare candidates. Do not rely on a single score without understanding what it measures.
Step 4: Open the individual chart.
Review the candlestick structure, recent price action, potential support and resistance levels, and other factors relevant to your strategy.
Step 5: Apply your own risk management.
A scanner can help identify potential setups, but it cannot eliminate uncertainty. Consider liquidity, trading fees, stop-loss placement, position sizing, and the possibility of sudden price reversals before entering a trade.
This process turns market scanning into a repeatable research routine rather than a search for guaranteed signals.
Why Automated Market Scanning Matters
The cryptocurrency market operates around the clock. Hundreds of trading pairs can move simultaneously, making it difficult for a person to monitor every relevant development manually.
Automated scanning helps address this problem by processing market data consistently and presenting selected results in an organized format.
Instead of spending time checking every asset individually, traders can begin with a ranked list and devote more attention to the most relevant candidates.
The main advantage is not a promise of better returns. It is a more structured approach to discovering and investigating market activity.
As the platform evolves, its multi-exchange direction can expand the range of markets available for analysis. Exchange availability and supported features should always be checked on the live service.
Start Exploring the Crypto Market with TradeBit.pro
Finding potentially interesting cryptocurrency setups does not have to begin with hours of manually checking charts.
TradeBit.pro brings market scanning, technical indicators, movement rankings, and strategy-based analysis together in one platform. Its free core functionality gives traders a way to explore market conditions, while optional paid strategy access provides an additional choice for users who need specialized analytical tools.
Whether you are looking for strong price movements, unusual volume, accelerating momentum, or potential LONG and SHORT setups, a market scanner can help you organize your research and focus on relevant opportunities.
Explore the cryptocurrency market with TradeBit.pro and build a more structured approach to trading analysis.
Visit TradeBit.pro to get started.
Disclaimer: TradeBit.pro provides market analysis tools and trading-related information for research and educational purposes. Scanner results and strategy signals are not financial advice and do not guarantee profitable outcomes. Cryptocurrency trading involves substantial risk, including the possible loss of your entire investment. Always conduct your own research and make independent trading decisions.

admin
TradeBit Blog author.